Hanamon Timeline Features
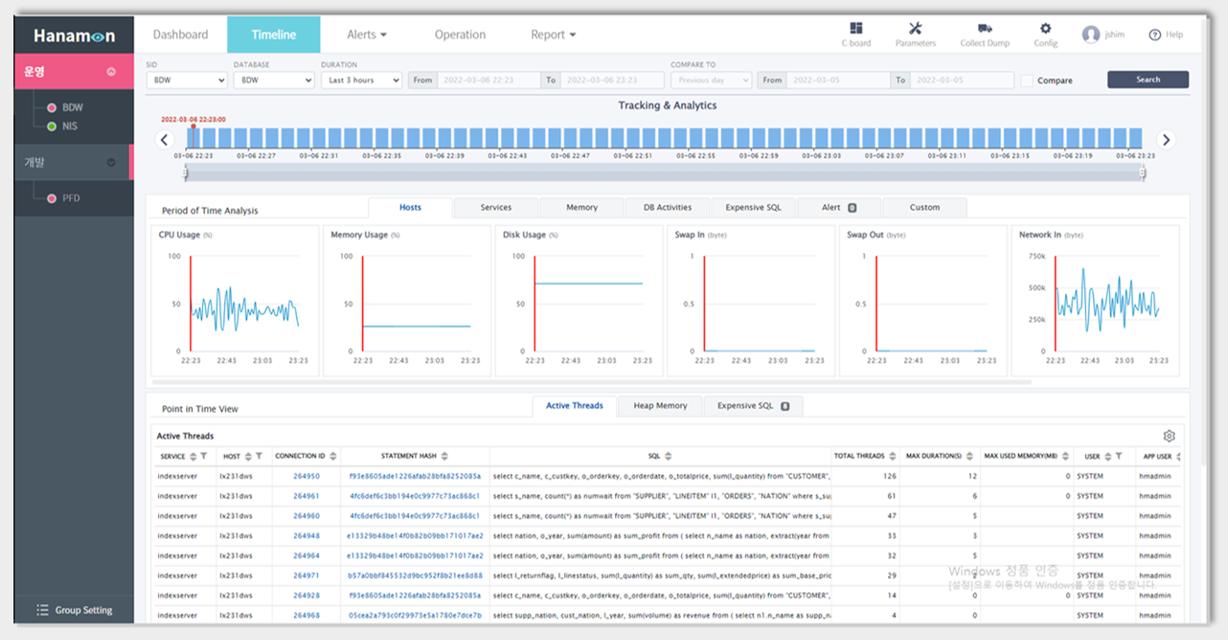
Hanamon Timeline은 현재 또는 과거 시점의 CPU, Memory, Disk 등 인프라 자원의 사용현황 그리고 Connection, Thread, SQL과
같은 활용현황에 대한 통합된 분석 view를 제공합니다.
Hanamon Timeline provides an integrated analysis view of the current status of the current and past status of CPU, memory, and disk, as well as the operational status of connections, threads, and SQL.
[ Timeline Feature List ]
Problem/Disaster 발생 시점에 대한 Tracking & Diagnosis 기반 제공
과거의 운용 이력에 대하여 시/분별로 Re-play가 가능하여 상세한 분석이 가능함
Session-Thread 및 Expensive SQL에 대한 Tracking 지원
기 수행된 SQL text 및 Plan View 확인하여 신속한 성능 튜닝이 가능함
Session-Connection 별 사용한 Resource usage 현황 제공
Host, Hana Service 및 DB Activity 운영 정보 상세에 대한 정보 제공
신속한 장애대응을 위하여 SAP HANA 시스템 로그에 대한 통합 View를 제공함
선택된 시간 대 또는 일간 시스템 자원 및 운용지표 상황에 대한 통합 차트 제공
필요 시 전일 해당 시간대의 시스템 운용지표(KPI)와 비교 분석이 가능함
Provides Tracking & Diagnosis based on when problems/disasters occurred.
Re-play can be performed by the hour/minute for past operation history for detailed analysis.
Tracking support for Session-Thread and Expensive SQL anaysis.
Quick performance tuning is possible by checking previously executed SQL text and Plan View.
Provides resource usage status by session-connection-thread.
Provides detailed information on Host, Hana Service and DB Activity operation.
Provides an integrated view of SAP HANA system logs for quick response to failures.
Provides an integrated chart of system resources and operational indicators for the selected time period or day.
Compare and analyze KPI of the corresponding time period from the day before.